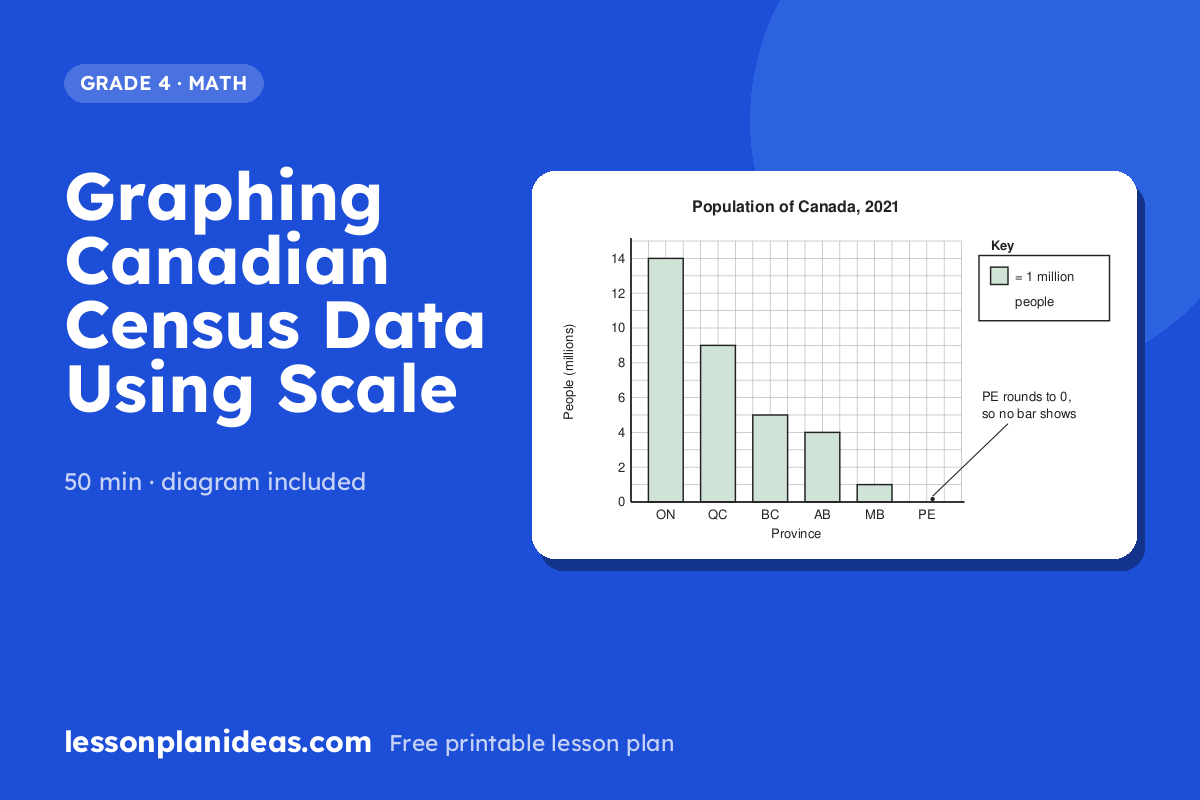
Graphing Canadian Census Data Using Scale
About this lesson
In this 50-minute Grade 4 math lesson, small groups turn rounded 2021 Census population numbers for Canada's provinces and territories into bar graphs on grid paper, using a scale where one square stands for one million people. They then answer graph questions in a whiteboard team round. Have grid paper, rulers, markers and mini whiteboards ready.
- Grade
- 4
- Subject
- Math
- Time
- 50 min
Objective
Students will construct a bar graph from Canadian census data using a many-to-one scale, then interpret and compare the data to draw conclusions about where Canadians live.
Materials
- Grid paper (1 cm squares), one sheet per group
- Rulers and pencils
- Coloured markers
- Chart paper or whiteboard showing the census data table
- Mini whiteboards and dry-erase markers (or scrap paper), one per group
Hook
Tell students that every five years, Statistics Canada tries to count every person living in Canada, and the 2021 Census counted almost 37 million people. Ask: 'If we wanted to draw one square for every person in Canada, how much paper would we need?' Let students guess, then explain that today they will learn how graph makers use a scale to fit huge numbers onto one page.
Main Activity
Post this table of 2021 Census populations, rounded to the nearest million: Ontario 14, Quebec 9, British Columbia 5, Alberta 4, Manitoba 1, Saskatchewan 1, Nova Scotia 1, New Brunswick 1, Newfoundland and Labrador 1, Prince Edward Island 0, Northwest Territories 0, Yukon 0, Nunavut 0. Read 'Ontario 14' together as 'about 14 million people.' Model how to set up a bar graph with a title, labelled axes and a scale where one square equals one million people, and draw the Ontario bar as an example. In groups of three or four, students draw a bar for every province and territory, colour the bars and write the scale in a key. When groups notice that Prince Edward Island and the territories have no bar at all, stop the class. Explain that those places really have about 150 000 and about 40 000 people each, and talk about how rounding and the scale hid them. Finish with a 'Census Says' team round. Ask questions such as 'How many more millions live in Quebec than in British Columbia?' or 'Which two provinces together have about the same population as British Columbia?' Each group writes its answer on a mini whiteboard and holds it up together for a point.

Discussion Questions
- Why do you think graph makers use a scale instead of drawing one square for every person?
- Prince Edward Island and the territories show no bar on our graph, but people definitely live there. How could we change the graph so their populations show up?
- What do you notice about where most Canadians live, and why might so many people live in Ontario and Quebec?
- If you were planning where to build new schools across Canada, how could this graph help you decide?
Exit Ticket
Draw a bar that is 7 squares tall on a graph where 1 square equals 1 million people. Write how many people the bar shows. Then write one sentence comparing it to the Ontario bar from today's graph.
Differentiation
Support: Give students a pre-made graph template with the axes, labels and scale already filled in so they focus only on counting squares for each bar. Pair them with a peer to read each number from the table aloud before drawing. Let them check each bar's height by counting squares with a finger.
Extension: Have students make a second bar graph showing only Prince Edward Island (about 150 000), Northwest Territories (about 41 000), Yukon (about 40 000) and Nunavut (about 37 000). They choose their own scale, such as 1 square equals 10 000 people, and explain in writing why they picked it.