Writing Linear Equations from Candle Burning Data
About this lesson
In this 45-minute Grade 8 lesson, students study how three holiday candles shrink as they burn. They build tables, graph the data, write equations in y = mx + b form, and find when each candle burns out, then journal about what slope and intercept mean in context. You need graph paper, rulers, pencils, notebooks, and a whiteboard.
- Grade
- 8
- Subject
- Math
- Time
- 45 min
Objective
Students will analyze candle burning data presented as words, a table, and a graph to write linear equations, interpret negative slope and y-intercept in context, and determine when each candle burns out.
Materials
- Graph paper
- Rulers
- Pencils and coloured pencils
- Student notebooks or math journals
- Whiteboard and markers
Hook
Dim the lights slightly and ask students to picture a candle glowing on a window ledge on a quiet December evening, the kind many families light around Christmas. Write this prompt on the board and give two silent minutes to journal: 'If you checked on the candle every hour, what would you notice about its height, and would it change in the same way each hour?' Invite two or three students to share their thoughts quietly.
Main Activity
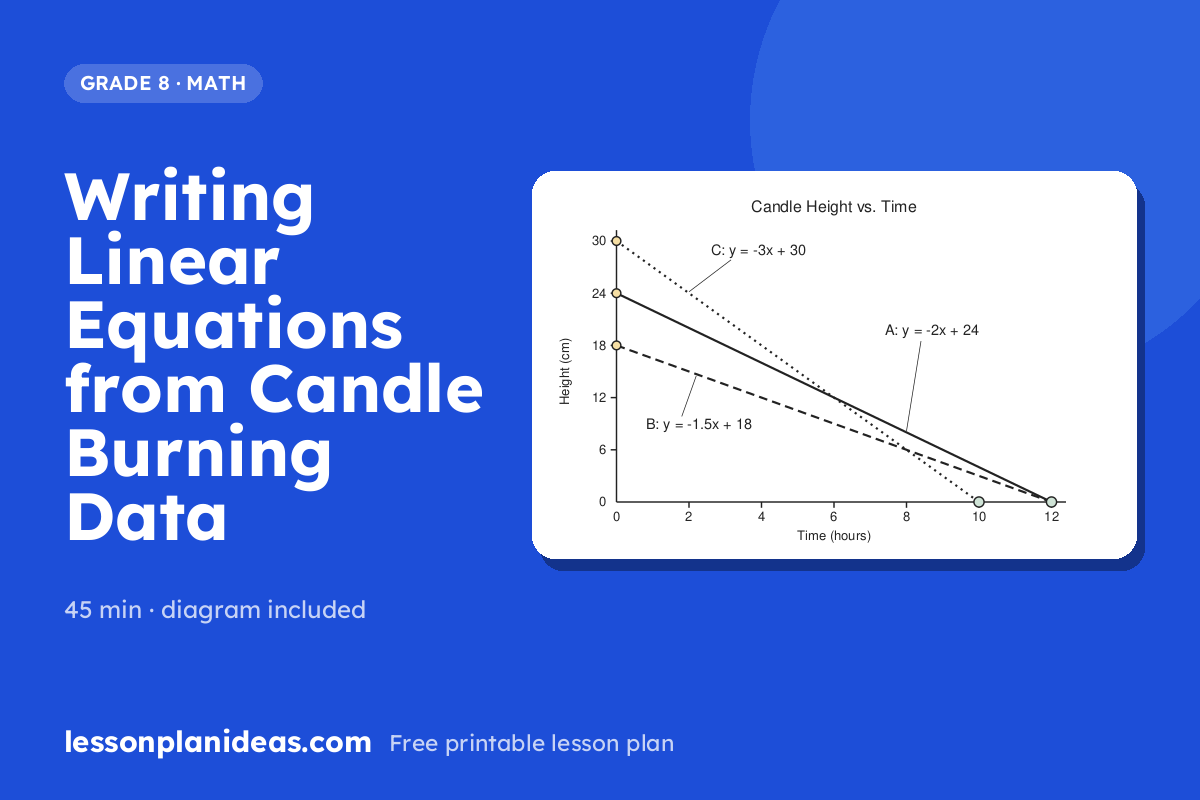
Write the data for three candles on the board, each in a different form. Candle A is described in words: it starts at 24 cm tall and burns 2 cm every hour. Candle B is shown as a table: at 0 hours it is 18 cm, at 2 hours 15 cm, and at 4 hours 12 cm. Candle C is shown as two points to plot: (0, 30) and (2, 24), with hours on the x-axis and height in centimetres on the y-axis. Working independently and quietly, students make a table for each candle, graph all three on one set of axes in different colours, and write an equation for each (A: y = -2x + 24, B: y = -1.5x + 18, C: y = -3x + 30). Students then find when each candle burns out by setting y = 0. Candles A and B both last 12 hours and Candle C lasts 10 hours. Finally, students write a short journal reflection explaining which candle burns fastest, how they can tell from the graph and from the equation, and why two candles of different heights can burn out at the same time.

Discussion Questions
- Why is the slope negative for every candle, and what would a positive slope mean in this situation?
- Candles A and B start at different heights but burn out at the same hour. What do you notice about their lines on the graph that explains this?
- Which form of data (words, table, or points) was easiest for you to turn into an equation, and why?
- Real candles may not burn at a perfectly steady rate. What might cause the data to be non-linear, and how would that change the graph?
- If you wanted a candle to last through a 16-hour holiday gathering, how could you use an equation to choose its starting height and burn rate?
Exit Ticket
A candle starts at 20 cm tall and is 17 cm tall after 2 hours. Write its equation in y = mx + b form, explain what the slope means in one sentence, and find how many hours it will take to burn out completely.
Differentiation
Support: Provide a partially completed table for each candle with hours 0 through 6 already listed, so students only fill in the heights. Model finding slope for Candle B on the board using 'change in height divided by change in time,' and give students a sentence frame for the journal: 'The candle loses ___ cm each hour, so the slope is ___.'
Extension: Ask students to find the exact time and height where the lines for Candle A and Candle C intersect, by solving -2x + 24 = -3x + 30 and checking the result in context. Then have them design a fourth candle that burns out at exactly the same time as Candle C but starts 6 cm shorter, write its equation, and explain their reasoning in their journal.